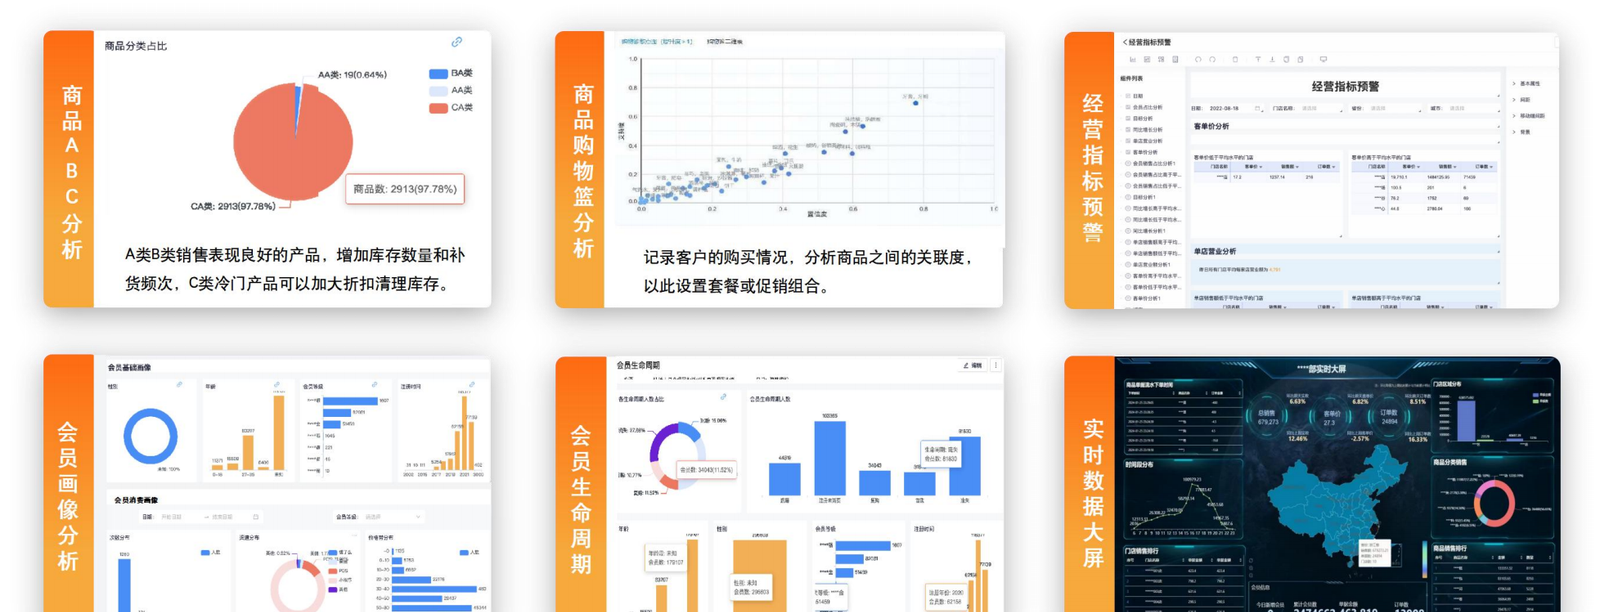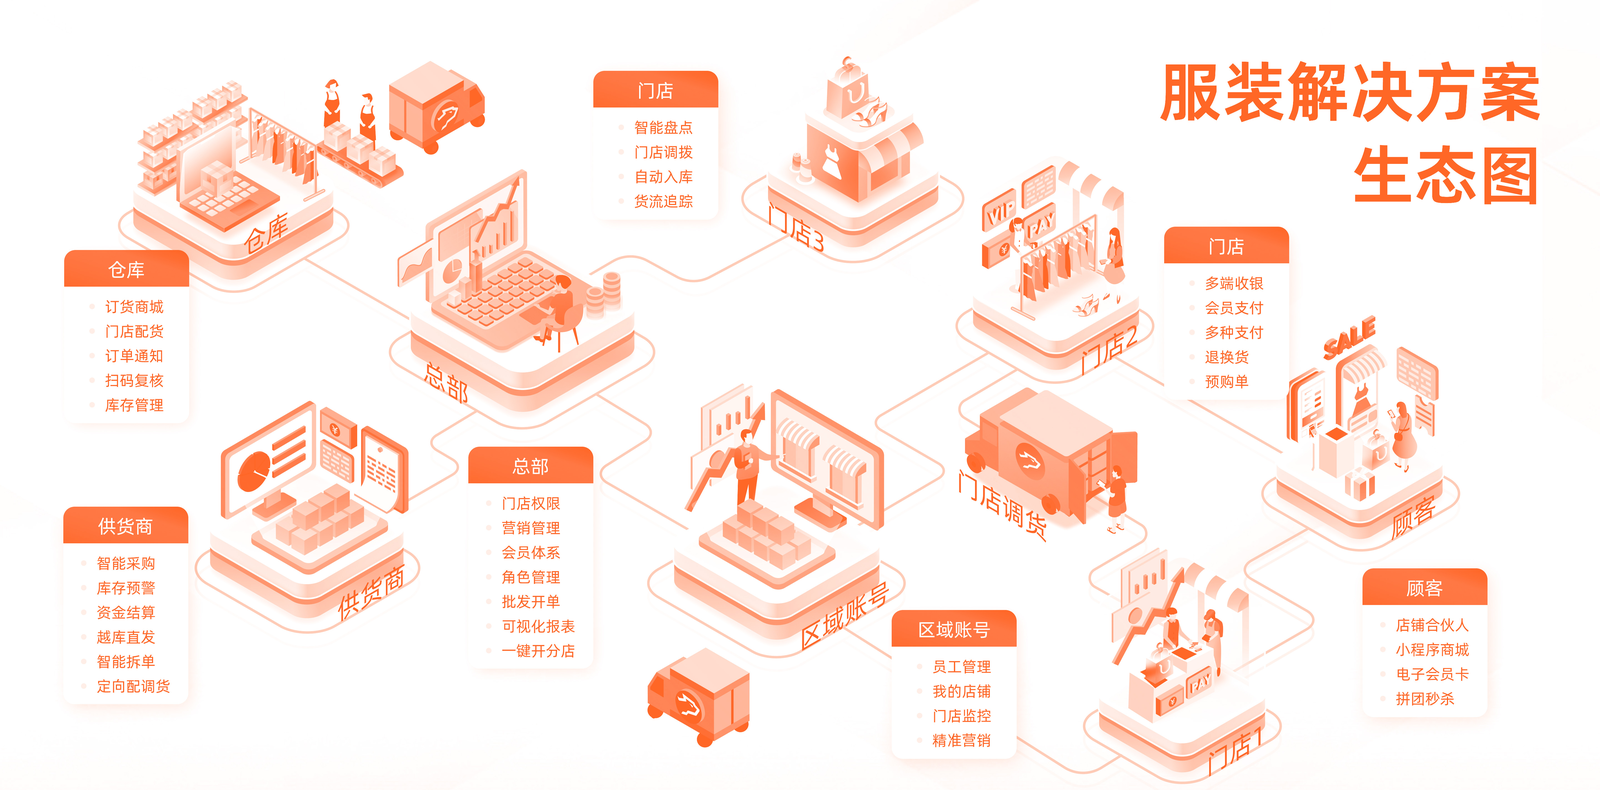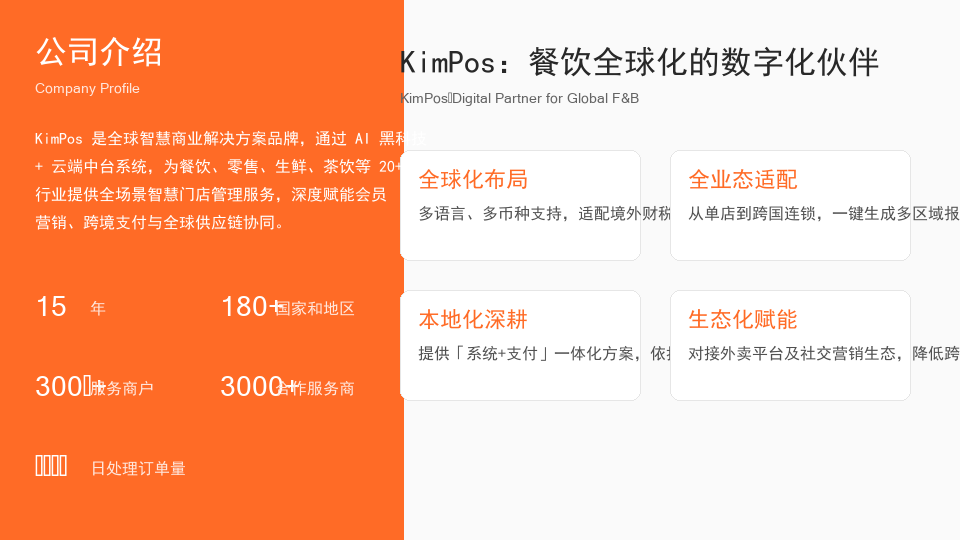
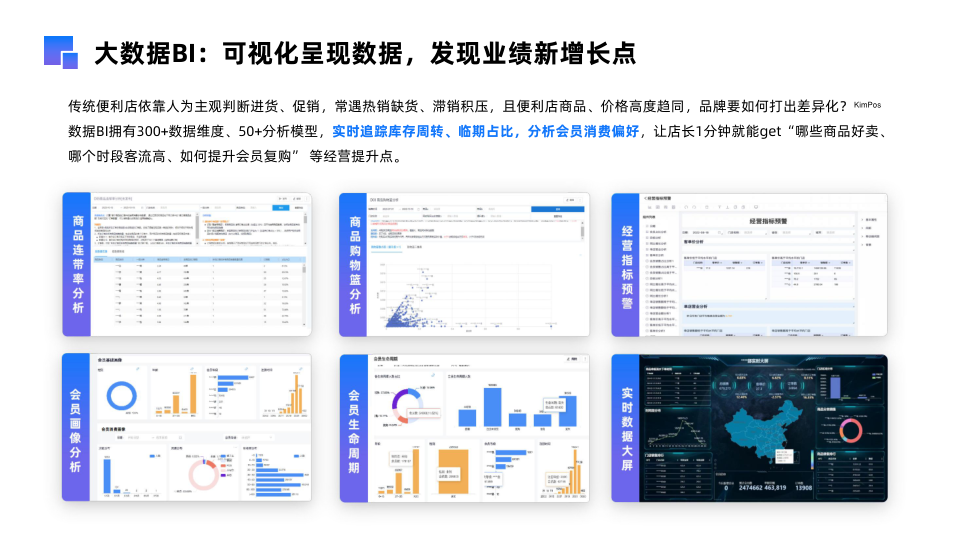
Real-time business dashboards, heat maps, category analysis and integrated business and financial reports make the input and output of every sale and promotion clearly visible.
Business cannot rely on feelings, it must rely on data
The KimPos data cockpit integrates sales, customer flow, unit price, category structure and promotion effects into a real-time dashboard. The boss can check the store's real-time revenue, hot-selling products and slow-selling warnings on his mobile phone or PC, so that he can make informed decisions instead of only discovering problems after checking the bills at the end of the month.
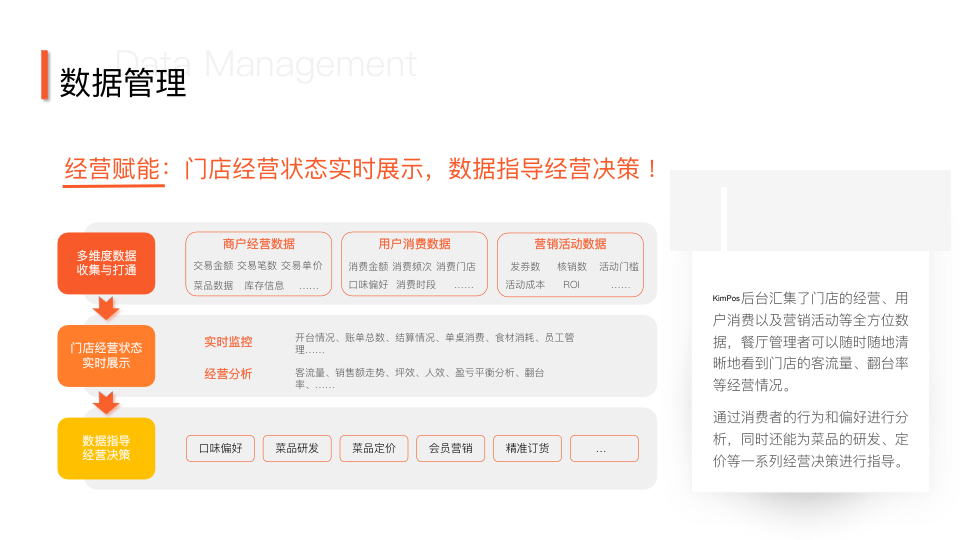
visible management
- Real-time revenue : Revenue, order volume, and customer price of the day/month are dynamically updated. You can see the results after opening the store.
- heat map analysis : identify peak hours and hot areas, optimize scheduling, display and stocking rhythm.
- Business and Finance Integration : Sales, inventory, cost, and profit are integrated, and the true gross profit of a drink/product can be seen in real time.
- Abnormal Alert : Proactive reminder for inventory anomalies, chargeback anomalies, and passenger flow anomalies to detect risks early.
The tea drink chain uses an integrated business and financial dashboard to allow the headquarters to use data to manage stores and the system to manage profits. This is a must-answer question in the era of thousands of stores.
mobile business office
Whether on a business trip or at home, the boss can check the store by turning on his mobile phone: real-time revenue, today's goal completion rate, employee performance, and new members can be seen at a glance. Multiple stores can be compared horizontally, and the experience of benchmark stores can be copied to other stores with one click, and management is no longer limited by space. Kanban can also drill down by store, time period, and category to discover detailed insights such as "Which product sells best on Wednesday afternoon" and "Which store clerk has the highest connection rate", turning data into actionable actions. With one-click export of periodic operating reports, weekly and monthly meetings no longer have to be improvised, and management spends more time solving problems rather than statistics.